Prometheus
In order to use Elastic Stack the
nem-monitoringhelm-chart needs to be installed. That is part of thecord-platformhelm-chart, but if you need to install it, please refer to this guide.
CORD uses Prometheus for storing time-series metrics related to the POD usage. Within Prometheus you'll find statistics related to traffic through the hardware and metrics about operational requests made to the pod.
On a running POD, Prometheus can be accessed at http://<pod-ip>:31301,
but we suggest to utilize Grafana that already provides custom CORD
dashboards, and is accessible at http://<pod-ip>:31301.
Unless you customized the chart installation, the credentials to access Grafana are:
username: admin
password: strongpassword
Visualize an existing dashboard in Grafana
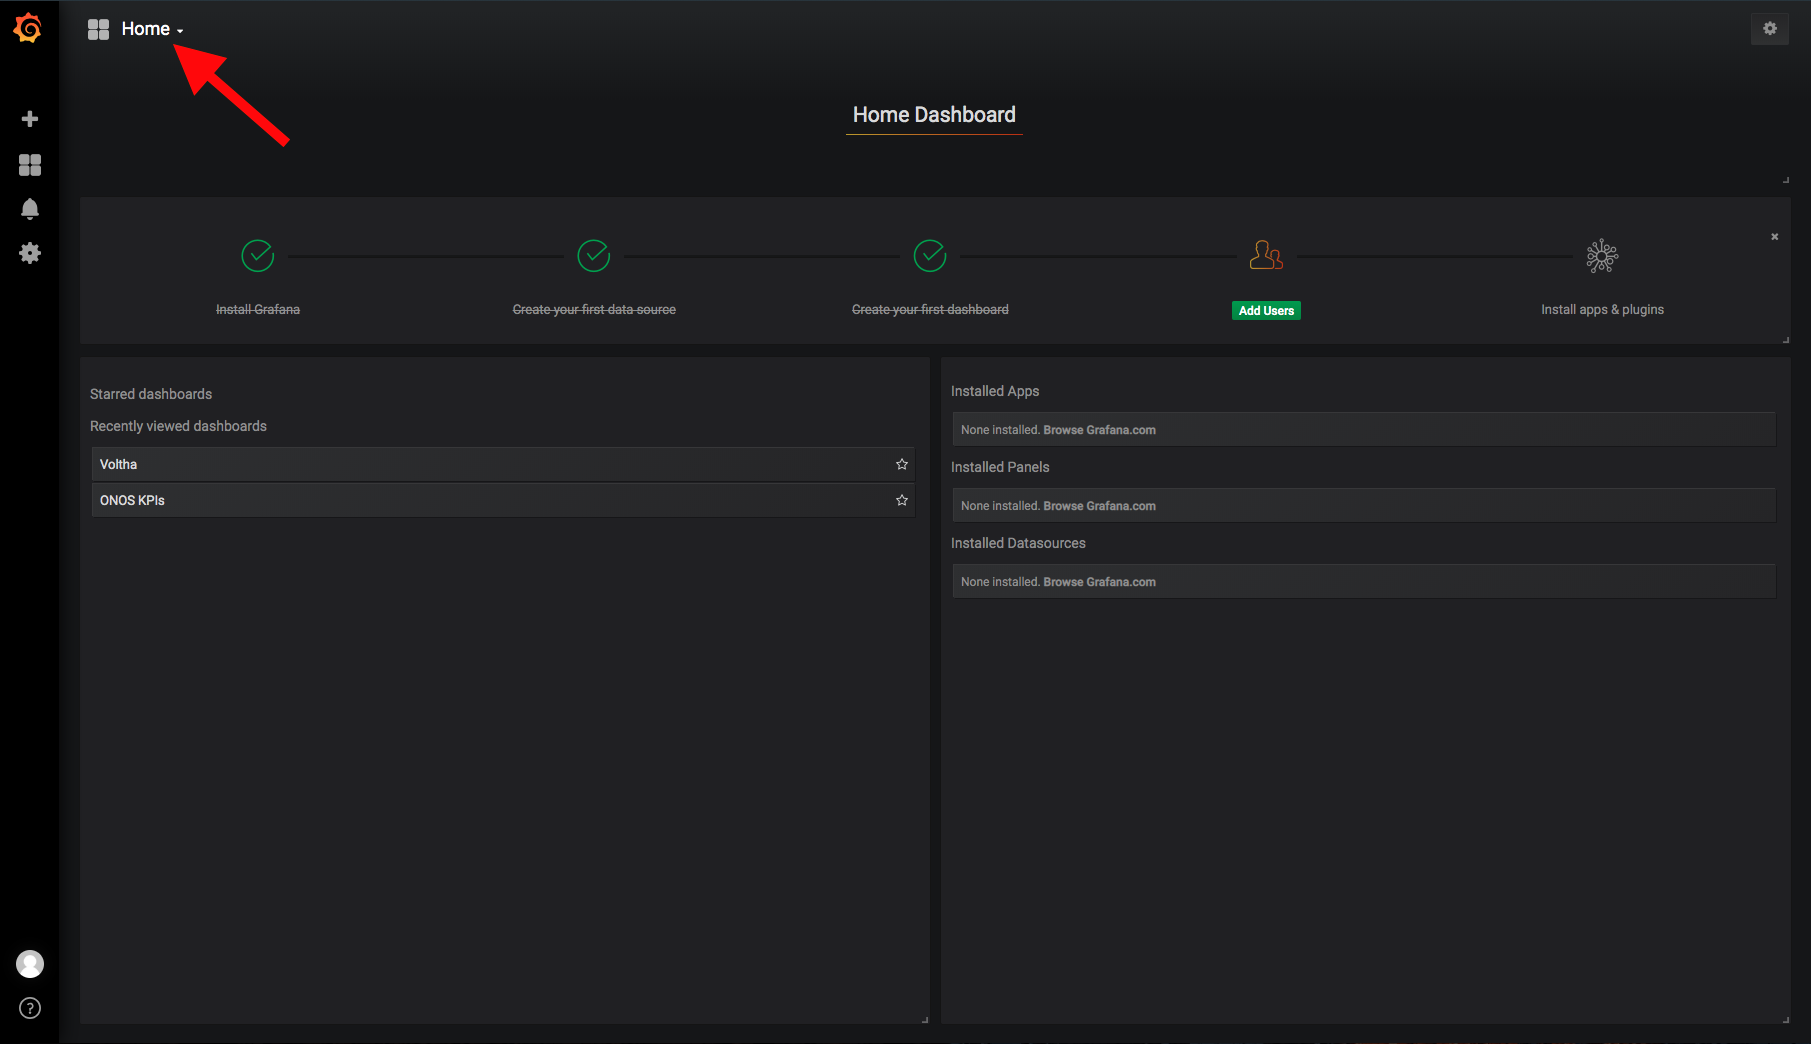
Once you are logged in Grafana you can list the existing dashboards by selecting the Home
dropdown menu on the top left of the window:
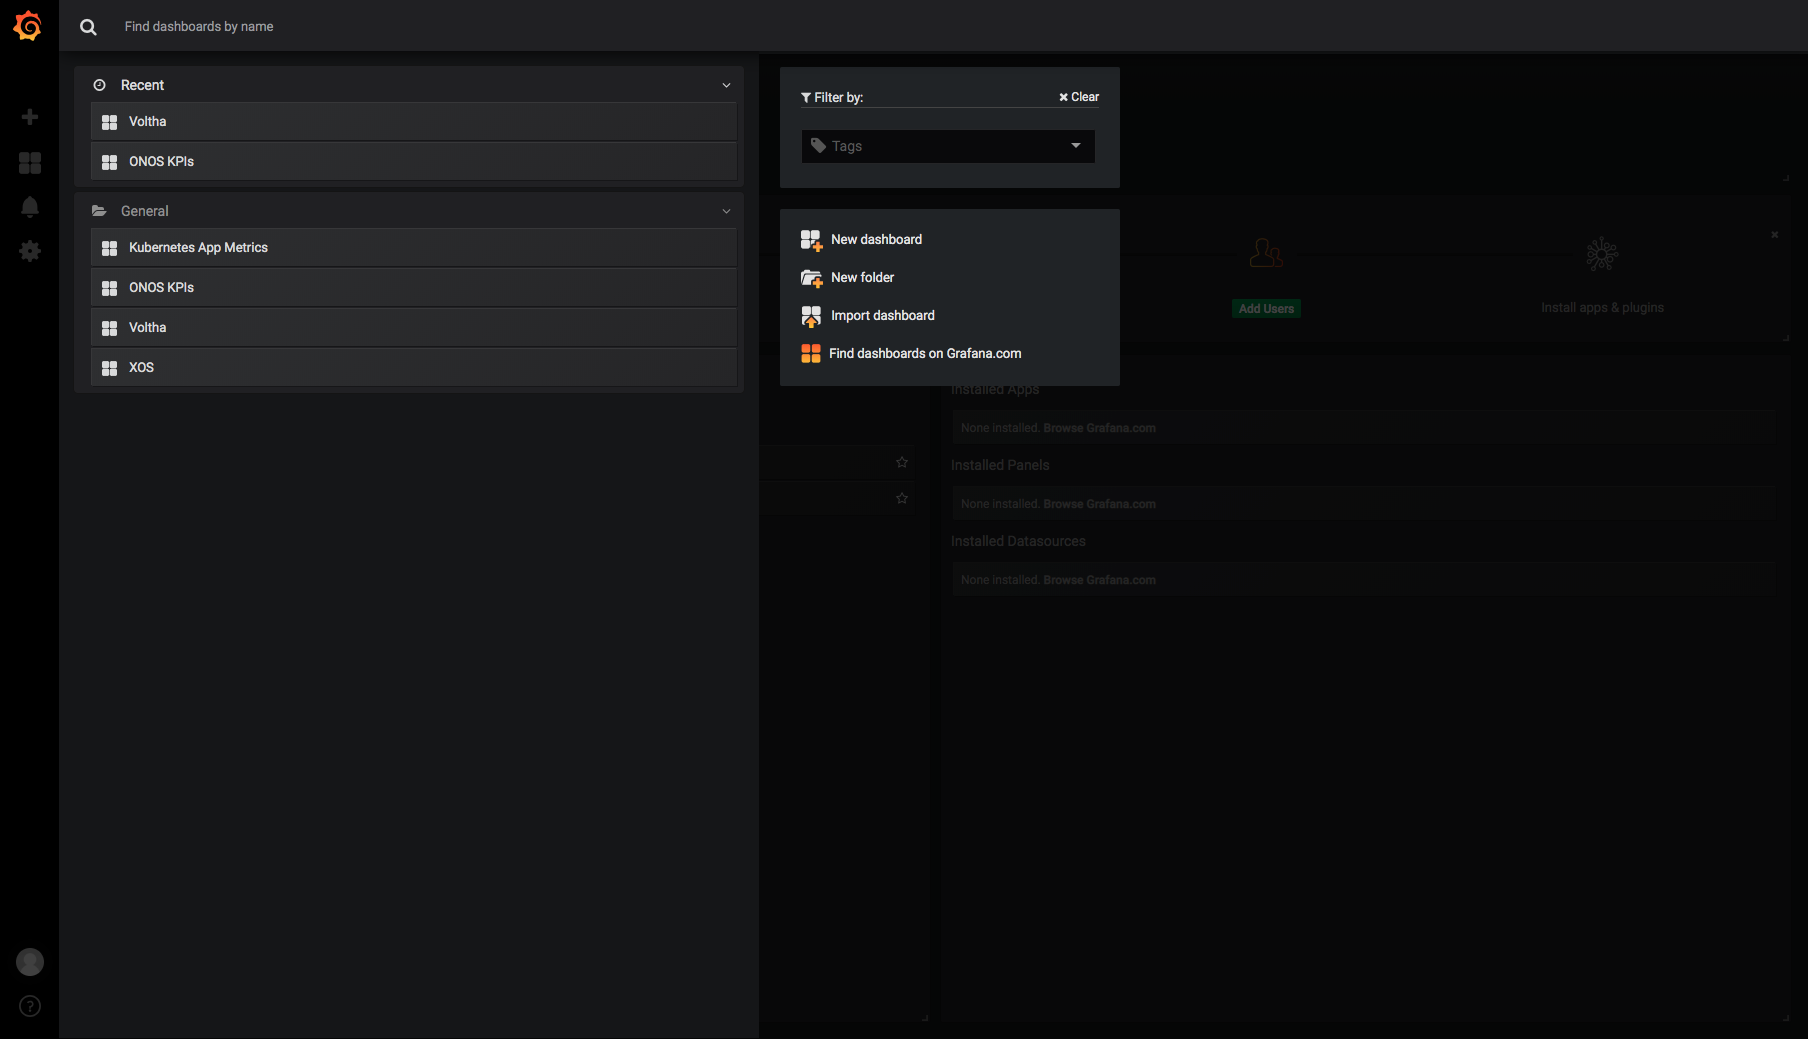
Then select the dashboard you are interested in simply by clicking on it:
I want to create a new visualization
That's great! Let's get started.
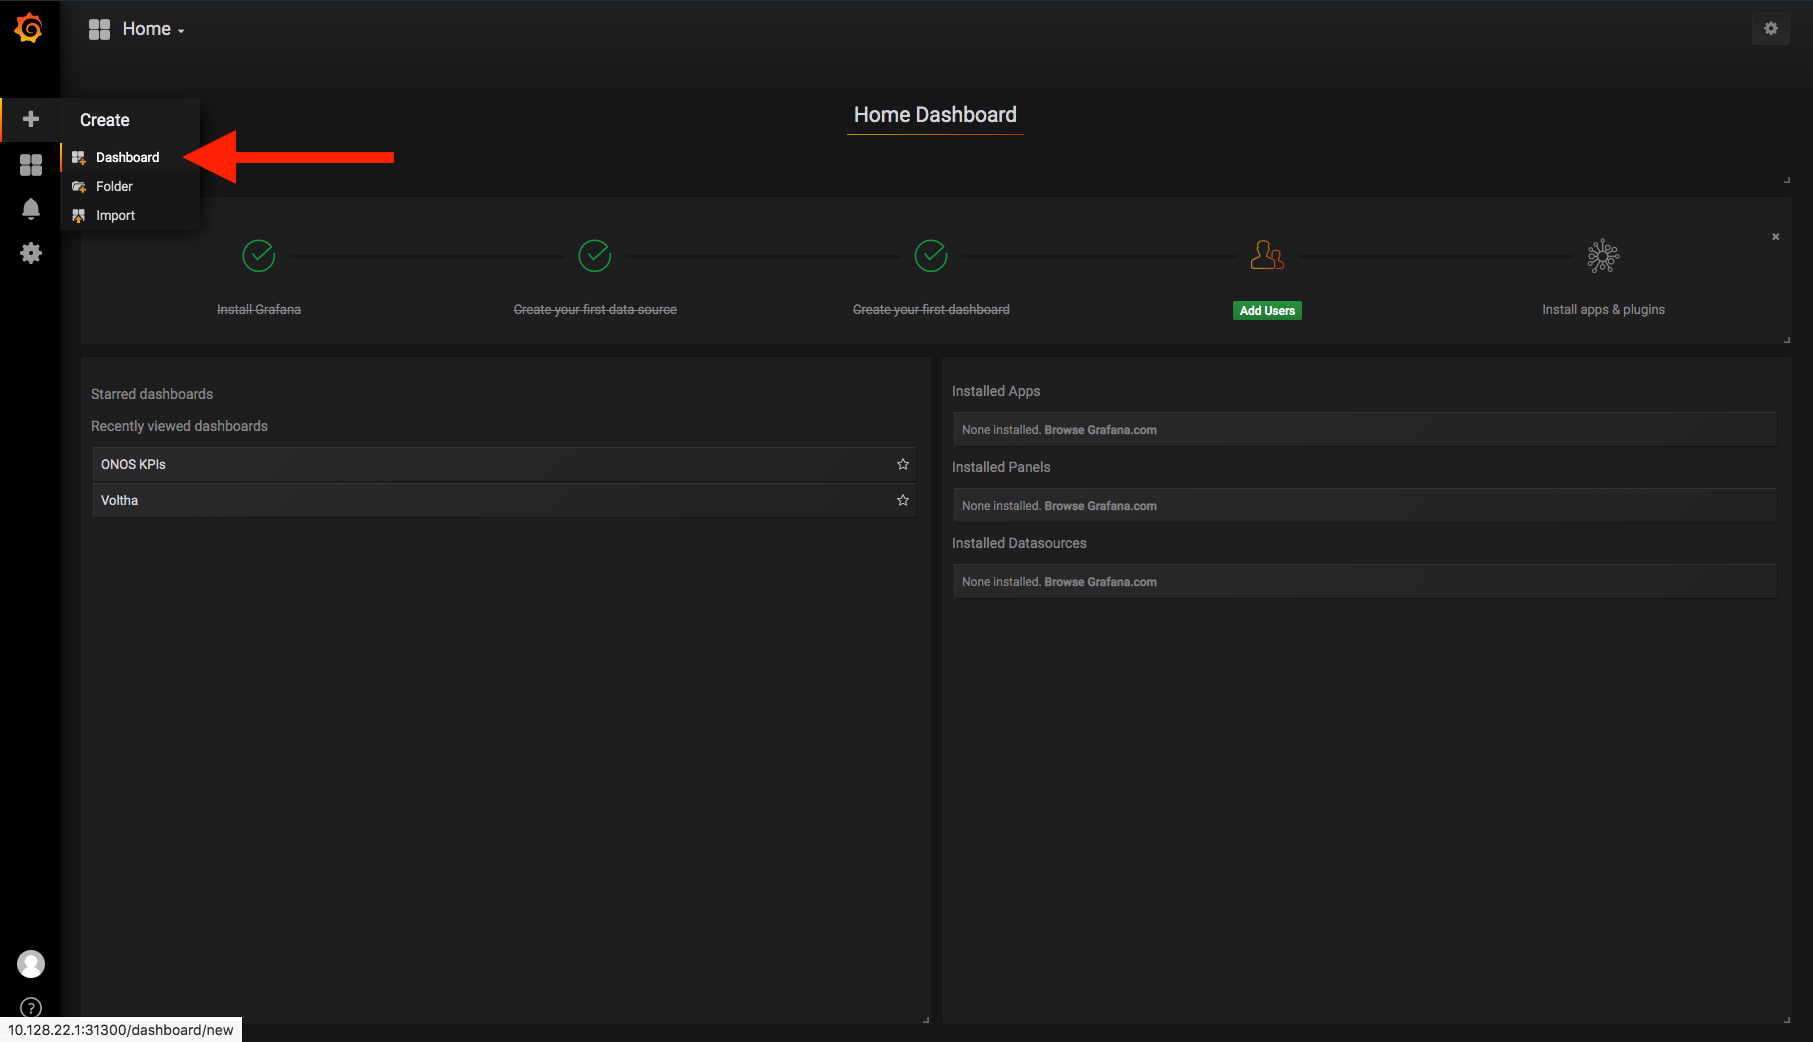
To create a new dashboard select the + sign in the Grafana sidebar and select Dashboard
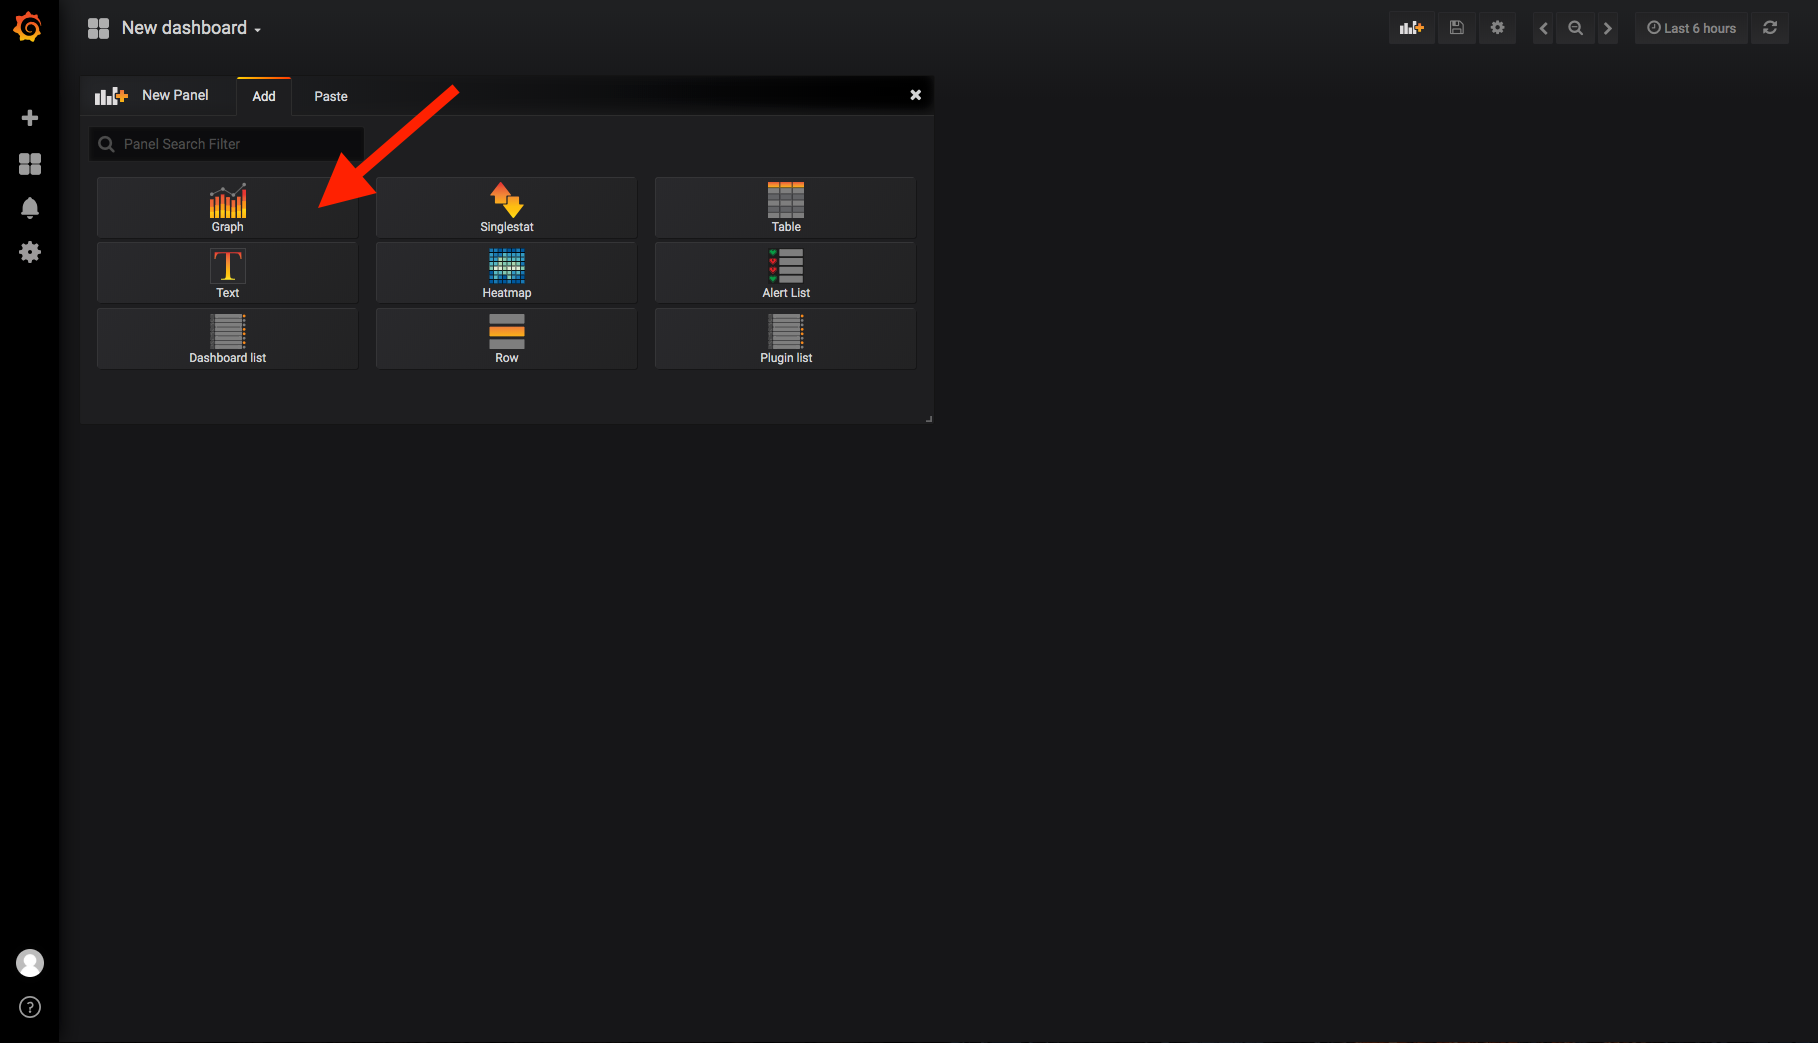
Then select the kind of visualization you want to add to that dashboard
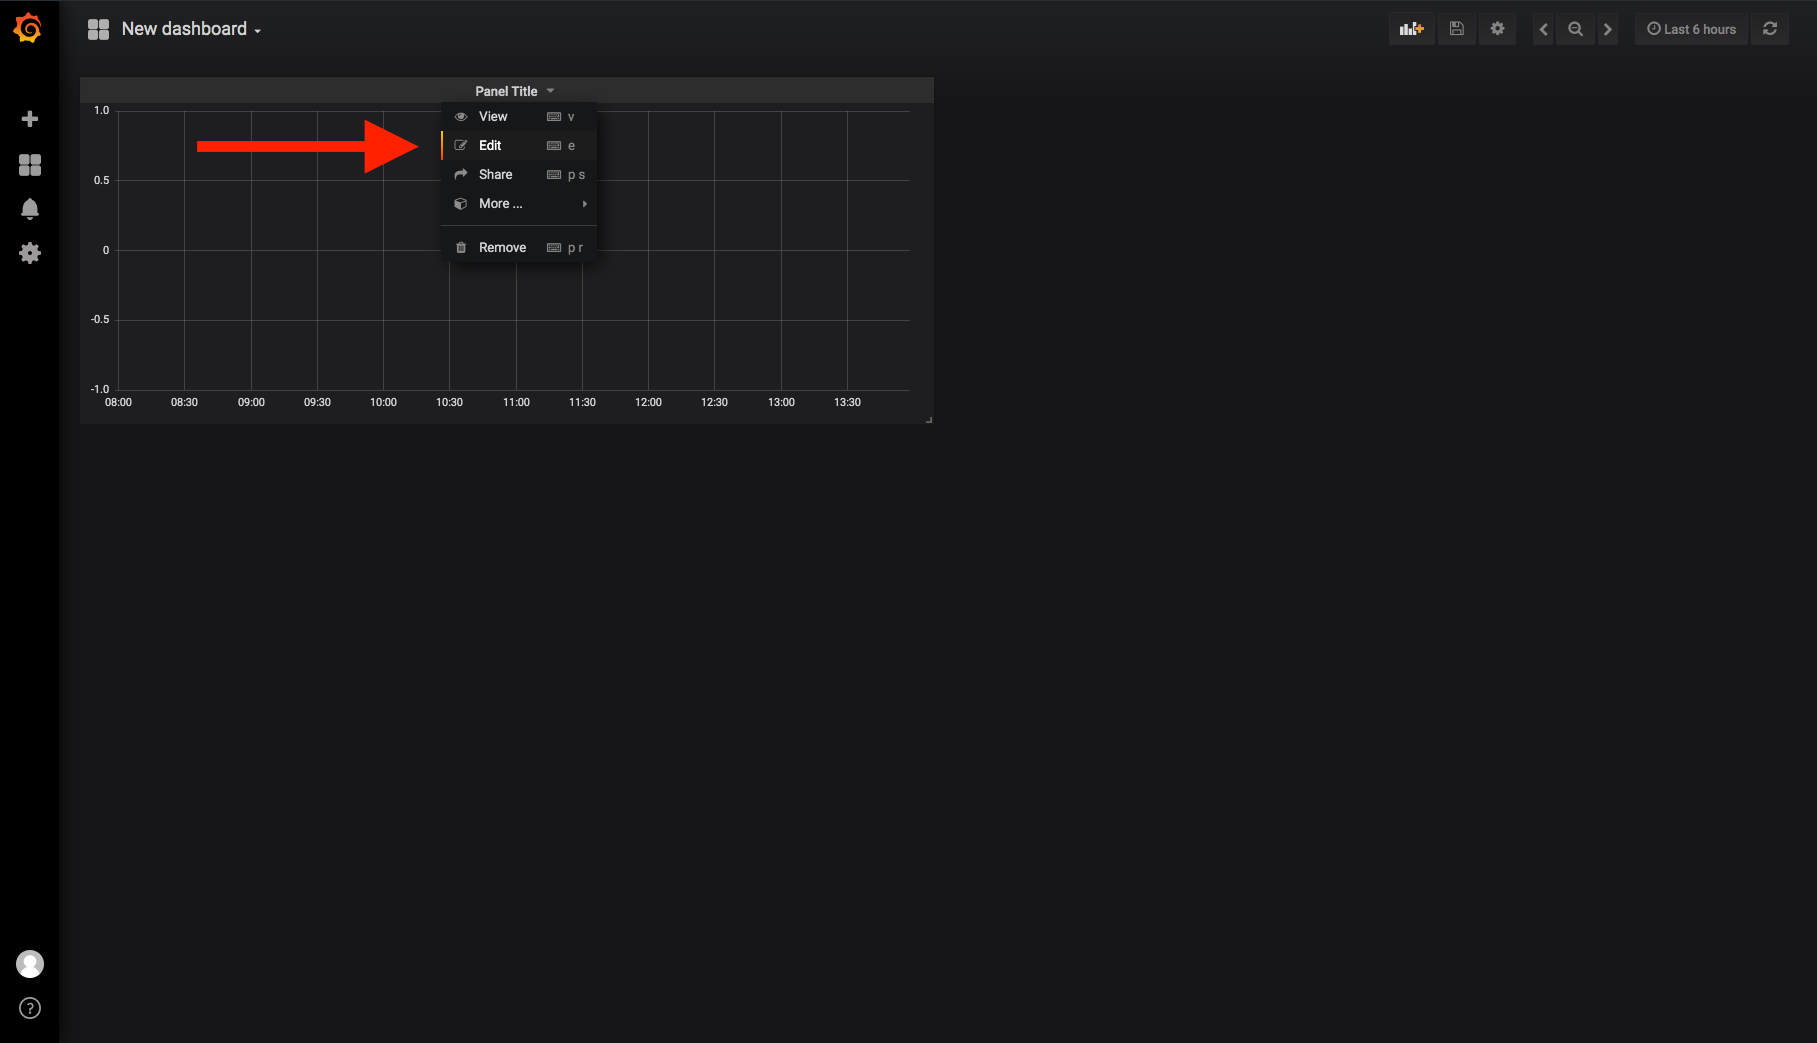
Once it has been added, click on the edit item in the panel dropdown
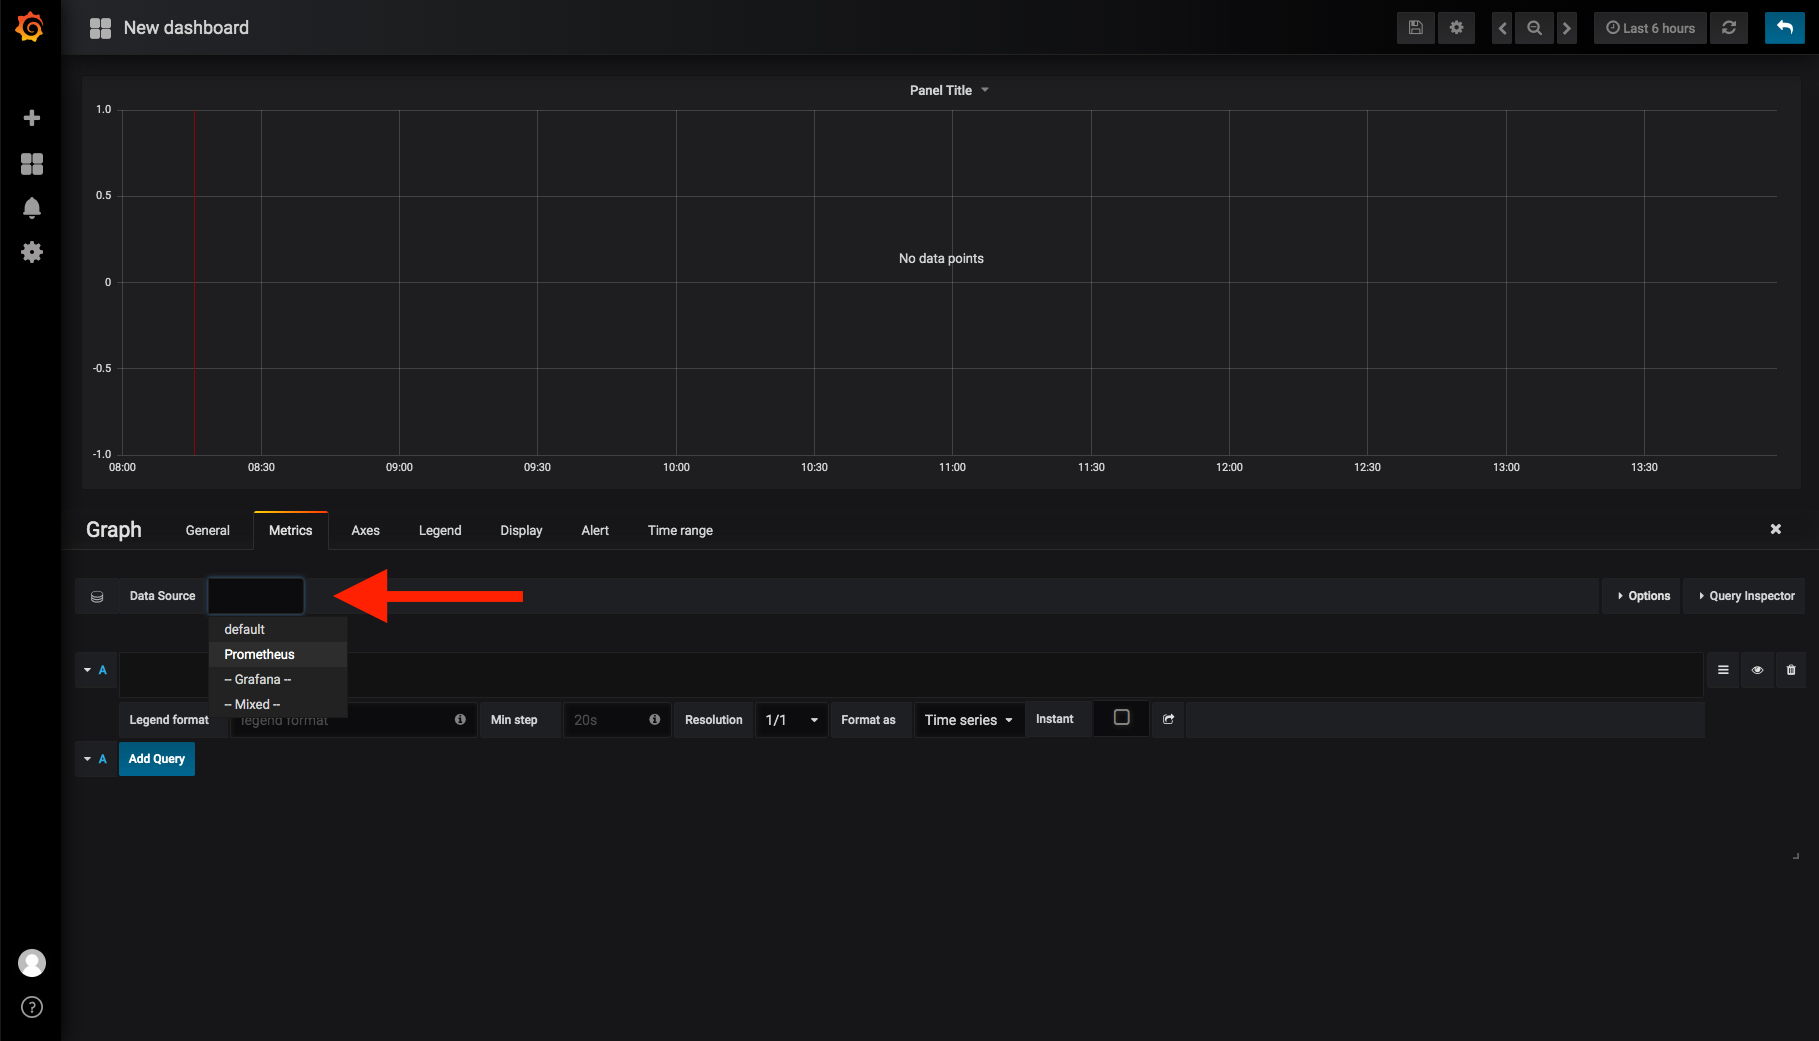
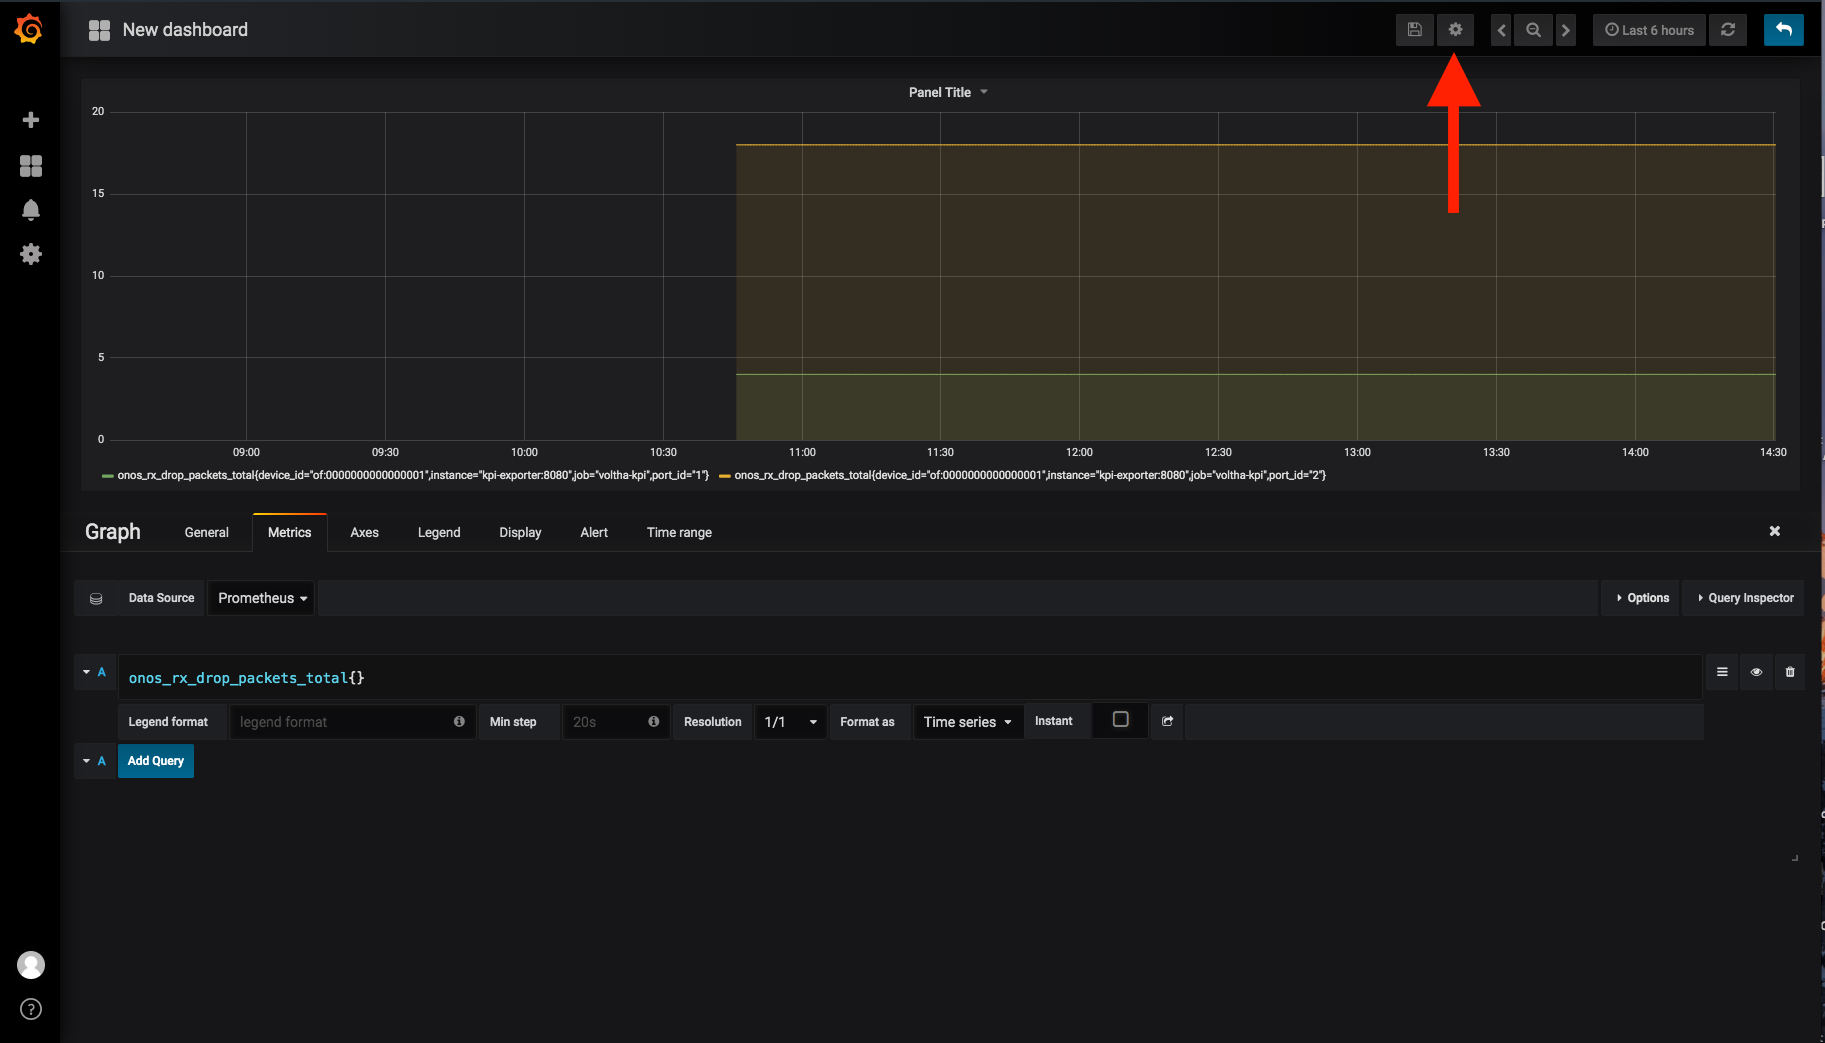
Now it's time to create the query that will populate the graph.
The first thing to do is to select the Data Source
And then create the query to display the metric you are interested into
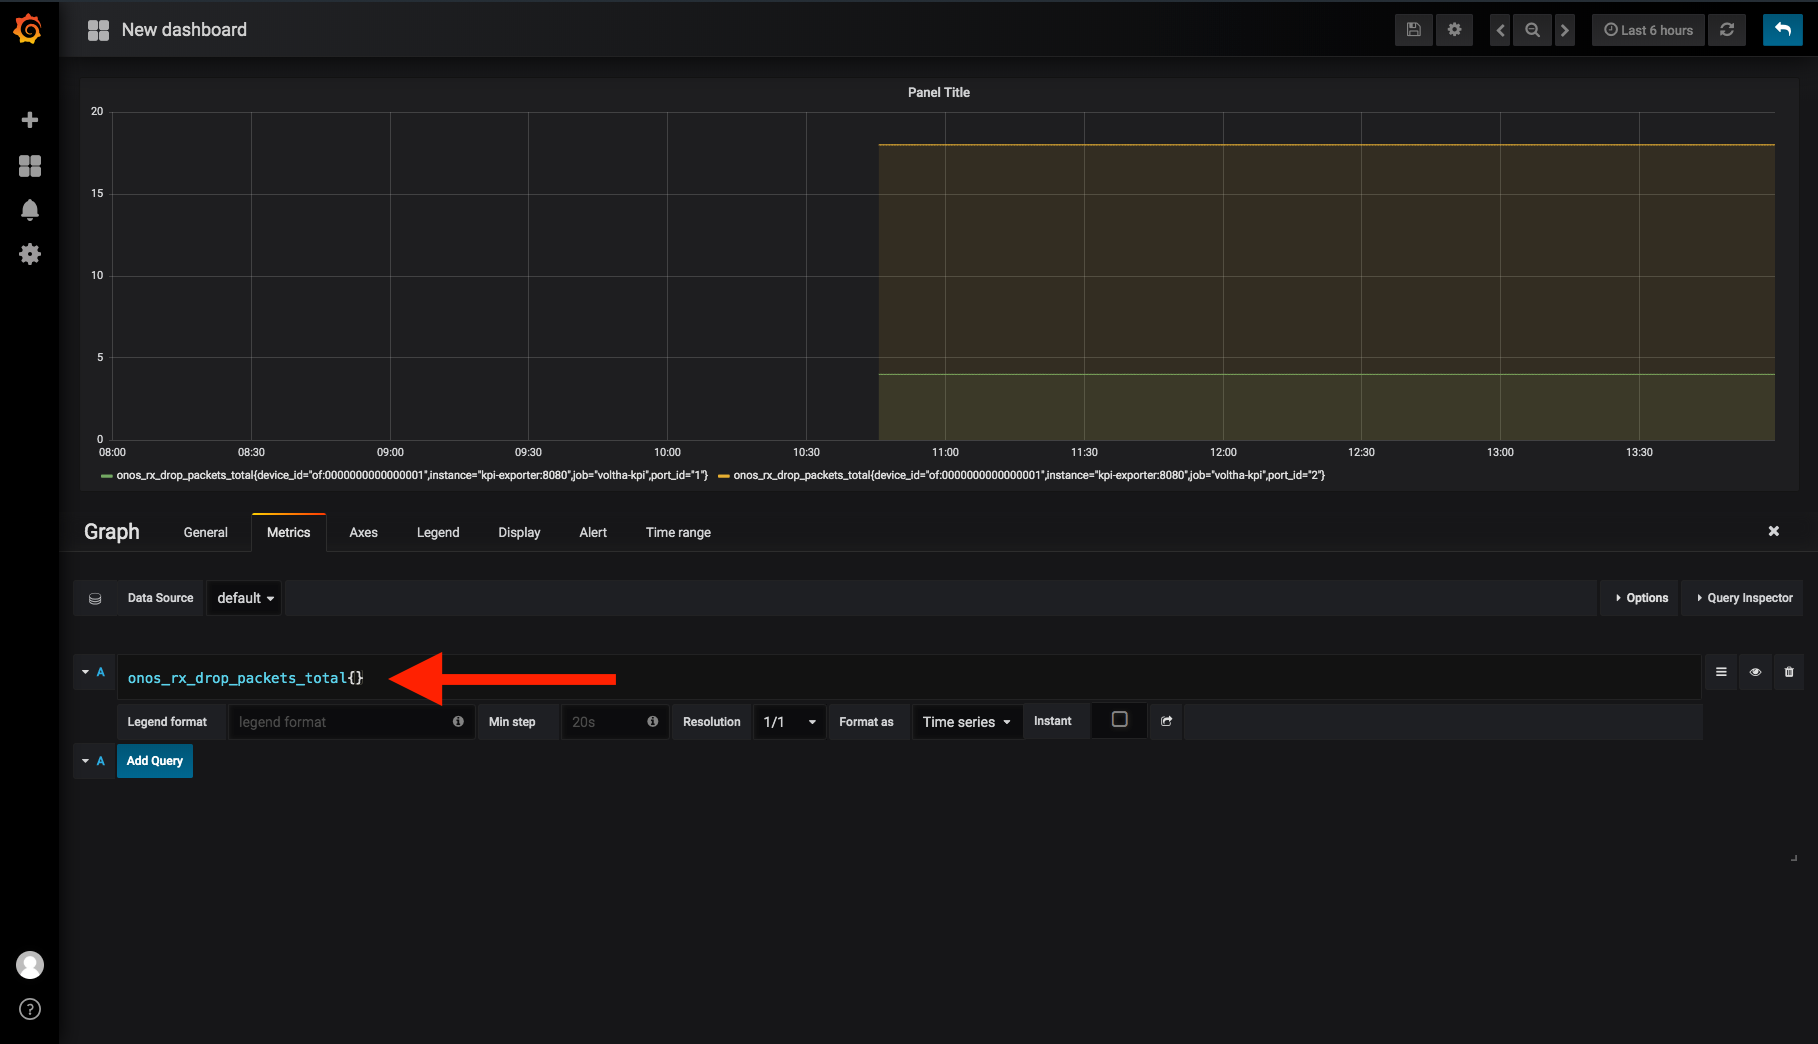
In order to write a meaningful query we suggest to consult the Prometheus documentation
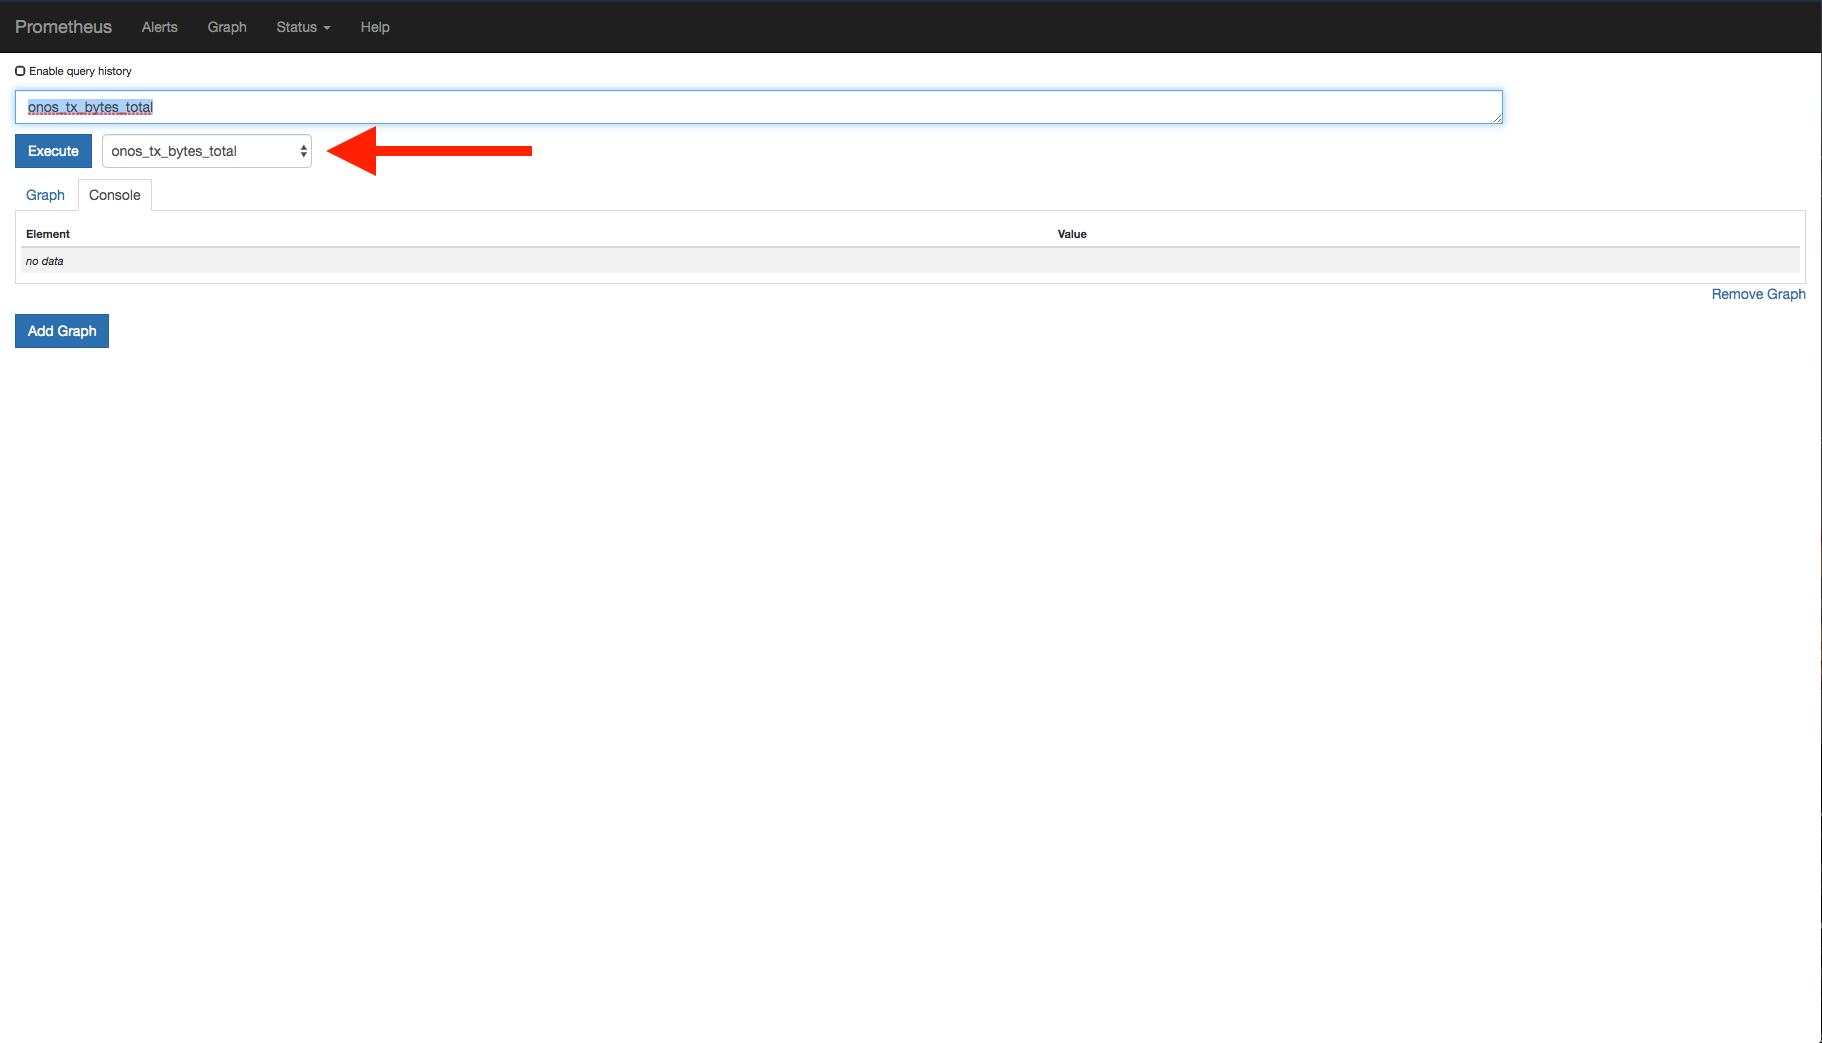
To find the list of metrics that are available in Prometheus open the Prometheus dashboard
at http://<pod-ip>:31301/graph and look them up in the dropdown
I want to save the new dashboard and make it available in CORD
That's even better! Here's what you need to do.
The CORD Grafana dashboard are made available through configmaps defined in the
nem-monitoring helm chart.
So the first thing to do is obtain the .json export of the dashboard.
To do that click on the Setting icon on the top right of the screen
then click on View JSON and copy the json into a file
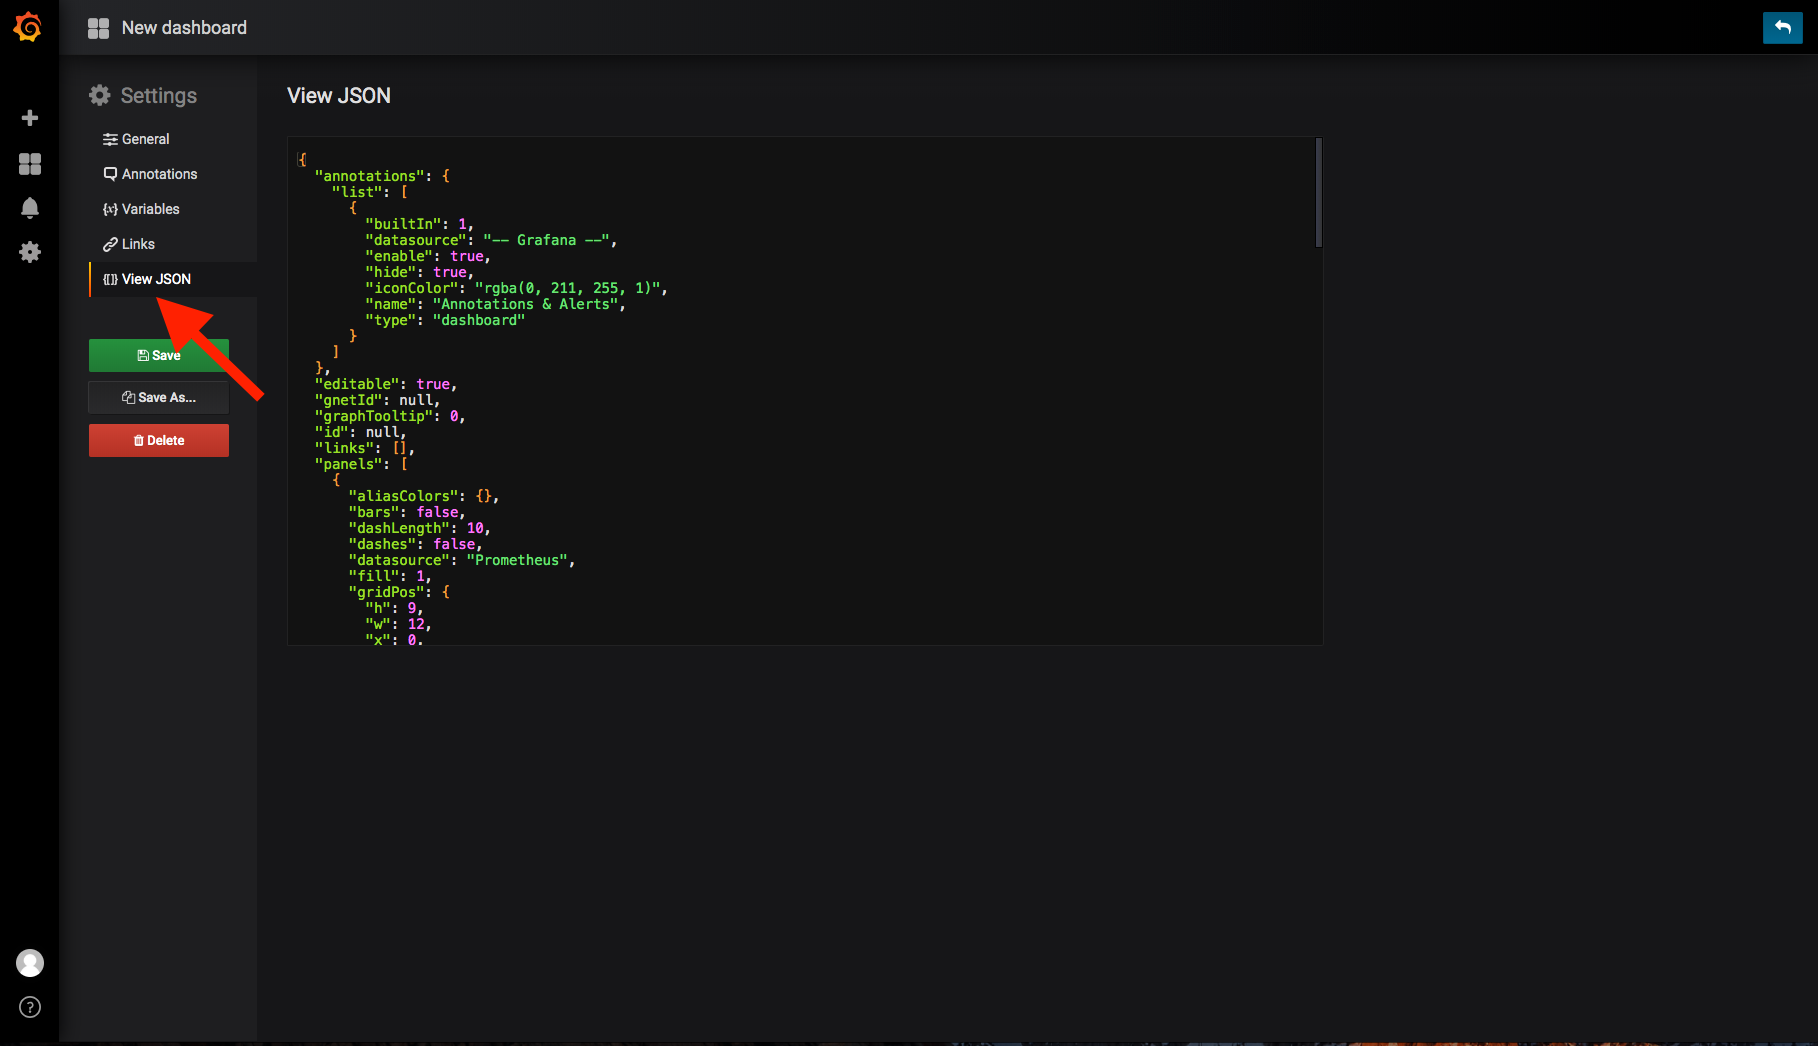
then you need to save the file in ~/cord/helm-charts/nem-monitoring/grafana-dashboards,
for this example we'll name that file my_dashboard.json.
In order to load that dashboard into Grafana at startup create a new configmap in
~/cord/helm-charts/nem-monitoring/templates/grafana-dashboard-my-dashboard-configmap.yaml
with the following content:
apiVersion: v1
kind: ConfigMap
metadata:
  name: grafana-dashboard-my-dashboard
  labels:
     grafana_dashboard: "1"
data:
  kb8s.json: |
{{ .Files.Get "grafana-dashboards/my_dashboard.json" | indent 4 }}
REST APIs based queries
In some cases you want to fetch some data from Prometheus via REST, following are some examples of the queries you can achieve, but we strongly suggest to refer to the official documentation
Get the latest values of a metric
curl -X GET -G http://10.128.22.1:31301/api/v1/query \
--data-urlencode 'query=onos_rx_bytes_total' | jq .
Example response:
{
  "status": "success",
  "data": {
    "resultType": "vector",
    "result": [
      {
        "metric": {
          "__name__": "onos_rx_bytes_total",
          "device_id": "of:0000000000000001",
          "instance": "kpi-exporter:8080",
          "job": "voltha-kpi",
          "port_id": "1"
        },
        "value": [
          1559256189.732,
          "3842"
        ]
      },
      {
        "metric": {
          "__name__": "onos_rx_bytes_total",
          "device_id": "of:0000000000000001",
          "instance": "kpi-exporter:8080",
          "job": "voltha-kpi",
          "port_id": "2"
        },
        "value": [
          1559256189.732,
          "496584"
        ]
      }
    ]
  }
}
Get the latest values of a metric with a filter
curl -X GET -G http://10.128.22.1:31301/api/v1/query \
--data-urlencode 'query=onos_rx_bytes_total{device_id="of:0000000000000001", port_id="1"}' | jq .
Example response:
{
  "status": "success",
  "data": {
    "resultType": "vector",
    "result": [
      {
        "metric": {
          "__name__": "onos_rx_bytes_total",
          "device_id": "of:0000000000000001",
          "instance": "kpi-exporter:8080",
          "job": "voltha-kpi",
          "port_id": "1"
        },
        "value": [
          1559256175.475,
          "3842"
        ]
      }
    ]
  }
}
Get the values of a metric with filters and a time range
export START=$(date -d '1 minute ago' -u +"%Y-%m-%dT%H:%M:%SZ")
export END=$(date -u +"%Y-%m-%dT%H:%M:%SZ")


curl -X GET -G 'http://10.128.22.1:31301/api/v1/query_range' \
--data-urlencode 'query=onos_rx_bytes_total{device_id="of:0000000000000001", port_id="1"}' \
--data-urlencode start=$START \
--data-urlencode end=$END \
--data-urlencode step=15s | jq .
Example response:
{
  "status": "success",
  "data": {
    "resultType": "matrix",
    "result": [
      {
        "metric": {
          "__name__": "onos_rx_bytes_total",
          "device_id": "of:0000000000000001",
          "instance": "kpi-exporter:8080",
          "job": "voltha-kpi",
          "port_id": "1"
        },
        "values": [
          [
            1559255865,
            "3842"
          ],
          [
            1559255880,
            "3842"
          ],
          [
            1559255895,
            "3842"
          ],
          [
            1559255910,
            "3842"
          ],
          [
            1559255925,
            "3842"
          ]
        ]
      }
    ]
  }
}