Troubleshooting
Sometimes, components may not come up in a clean state. In this case, following paragraph may help you to debug, and fix the issues.
Most of the times, debug means do the procedure that the automated process would do, manually. Here are few manual configuration examples.
Before reading this paragraph, make sure you’ve already covered the general CORD troubleshooting guide, at in the main troubleshooting section.
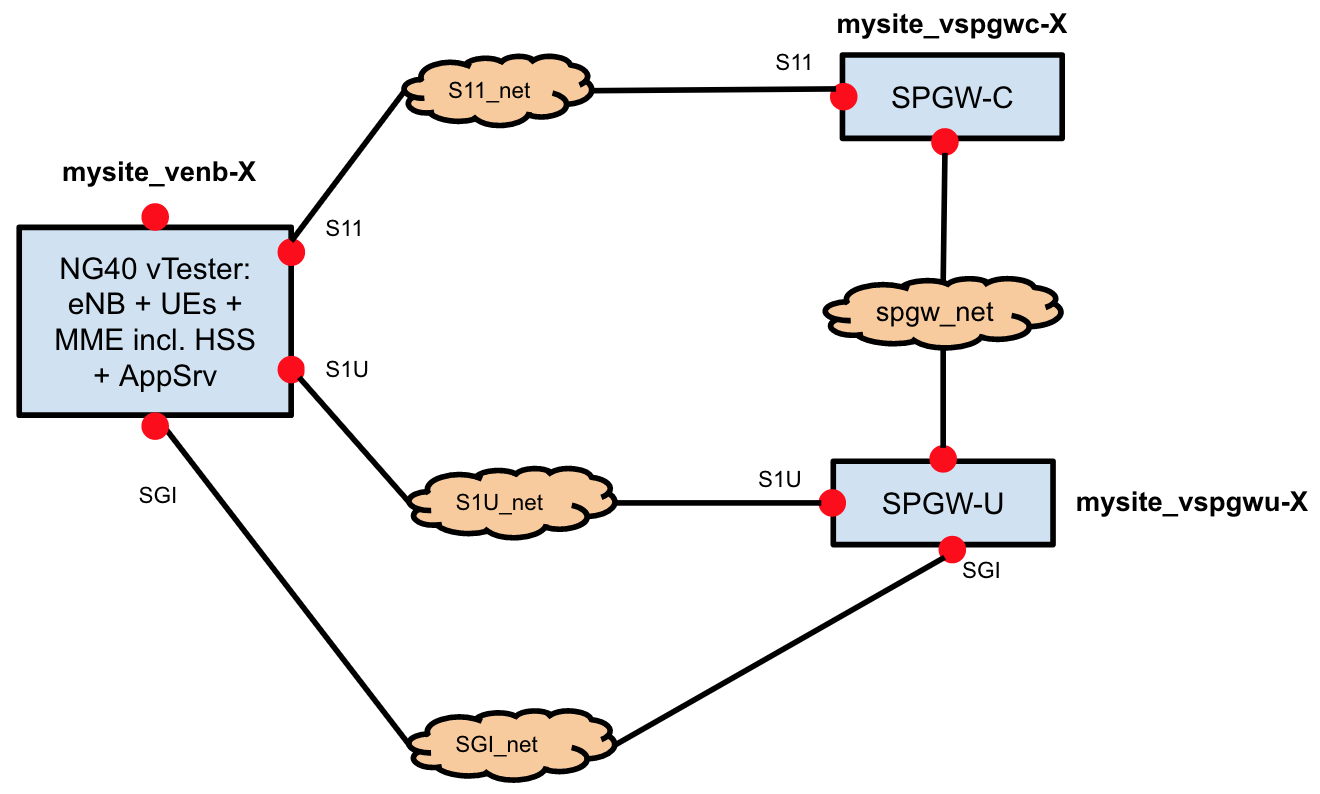
The troubleshooting guide often mentions interfaces, IPs and networks. For reference, you can use the diagram below.
See the status and the IP addresses of your VNFs
You may often need to check the status of your M-CORD VNFs, or access them to apply some extra configurations or to debug. To check the status or to know the IP of your VNF, do the following:
- SSH into the head node
- Type following commands:
source /opt/cord_profile/admin-openrc.sh
nova list --all-tenants
View interface details for a specific VNF
- SSH into the head node
- List your VNF VMs, following the procedure at
- Find the ID of the specific instance (i.e.
92dff317-732f-4a6a-aa0d-56a225e9efae) - To get the interfaces details of the VNF, do
nova interface-list ID_YOU_FOUND_ABOVE
How to log into a VNF VM
Sometimes, you may need to access a VNF (VM) running on one of the compute nodes. To access a VNF, do the following.
- SSH into the head node
- From the head node, SSH into the compute node running the VNF. Use the following commands:
ssh-agent bash
ssh-add
ssh -A ubuntu@COMPUTE_NODE_NAME
Note: You can get your compute node name typing cord prov list on the head node
- SSH into the VM from compute node
ssh ubuntu@IP_OF_YOUR_VNF_VM
Note: To know the IP of your VNF, refer to this paragraph. The IP you need is the one reported under the
management network.
View an interface name, inside a VNF
In the troubleshooting steps below you’ll be often asked to provide a specific VNF name. To do that, follow the steps below:
- From the head node, find the IP address of the VNF interface attached to a specific network. To do that, refer to the steps reported here.
- SSH into the VNF, following the steps here.
- Run ifconfig inside the VNF. Look for the interface IP you discovered at the steps above. You should see listed on the side the interface name.
Understand the M-CORD Synchronizers logs
As the word says, synchronizers are XOS components responsible to synchronize the VNFs status with the configuration input by the Operator. More informations about what synchronizers are and how they work, can be found [here](../../xos/dev/synchronizers.md>.
In case of issues, users may need to check the XOS synchronizers logs. Synchronizers are no more than Docker containers running on the head node. Users can access their logs simply using standard Docker commands:
- SSH into the head node
- Type the following
docker logs -f NAME_OF_THE_SYNCHRONIZER
Note: to list the containers running on the head node (including the ones operating as synchronizers), use the command
docker ps.
It may happen that some error messages appear in the logs of your M-CORD VNF synchronizers.
Following, is a list of the most common cases.
Case 1: “Exception: defer object
<something>_instance<#>due to waiting on instance” It means a VNF cannot come up correctly. To check the overall instances status, follow the procedure described here. If your instances are in any status other thanACTIVEorBUILDthere’s an issue. This might happen simply because something temporarily failed during the provisioning process (so you should try to rebuild your VNFs again, following these instructions, or because there are more serious issues.Case 2: “Exception: IP of SSH proxy not available. Synchronization deferred” It means that the Ansible playbook wasn’t able to access some images, since SSH proxy wasn’t available yet. The SSH proxy usually need some time to become available, and the error message automatically disappear when this happens, so you shouldn’t worry about it, as long as the message doesn’t keep showing up.
Case 3: Any failed message of ansible playbook Finding errors related to Ansible is quite common. While it may be possible to fix the issue manually, it’s generally desirable to build and deploy again the VNFs. This will run the entire Ansible playbook again. See here for more details.
Any other issue? Please report it to us at cord-dev@opencord.org. We will try to fix it as soon as possible.
Check the SPGW-C and the SPGW-U Status
Sometimes, you may want to double check if your SPGW-C and SPGW-U components status. To do that, follow the steps below.
SPGW-C
- SSH into
SPGW-CVNF with credentialsngic/ngic(to access the VNF follow this guidelines) - Become the root user (the system will pause for a few seconds)
$ sudo bash - Go to
/root/ngic/cp- If the file
finish_flag_interface_configexists, theSPGW-Chas been successfully configured - It the file
finish_flag_build_and_runexists, theSPGW-Cbuild process has successfully completed
- If the file
- Open the
resultsfile. It’s theSPGW-Cbuild log file. If the file has similar contents to the one shown below, it means the SPGW-C has been successfully started.
            rx       tx  rx pkts  tx pkts   create   modify  b resrc   create   delete   delete           rel acc               ddn
 time     pkts     pkts     /sec     /sec  session   bearer      cmd   bearer   bearer  session     echo   bearer      ddn      ack
    0        0        0        0        0        0        0        0        0        0        0        0        0        0        0
    1        0        0        0        0        0        0        0        0        0        0        0        0        0        0
SPGW-U
- SSH into
SPGW-UVNF with credentialsngic/ngic(to access the VNF follow these guidelines) - Go to
/root/ngic/dp- If the file
finish_flag_interface_configexists, theSPGW-Uhas been successfully configured - It the file
finish_flag_build_and_runexists, theSPGW-Ubuild process completed successfully
- If the file
- Open the
resultsfile. It’s theSPGW-Ubuild log file. If the file has similar contents to the one shown below, it means theSPGW-Uhas been successfully started.
DP: RTE NOTICE enabled on lcore 1
DP: RTE INFO enabled on lcore 1
DP: RTE NOTICE enabled on lcore 0
DP: RTE INFO enabled on lcore 0
DP: RTE NOTICE enabled on lcore 3
DP: RTE INFO enabled on lcore 3
DP: RTE NOTICE enabled on lcore 5
DP: RTE INFO enabled on lcore 5
DP: RTE NOTICE enabled on lcore 4
DP: RTE INFO enabled on lcore 4
API: RTE NOTICE enabled on lcore 4
API: RTE INFO enabled on lcore 4
DP: RTE NOTICE enabled on lcore 6
DP: RTE INFO enabled on lcore 6
DP: RTE NOTICE enabled on lcore 2
DP: RTE INFO enabled on lcore 2
DP: MTR_PROFILE ADD: index 1 cir:64000, cbd:3072, ebs:3072
Logging CDR Records to ./cdr/20171122165107.cur
DP: ACL DEL:SDF rule_id:99999
DP: MTR_PROFILE ADD: index 2 cir:125000, cbd:3072, ebs:3072
DP: MTR_PROFILE ADD: index 3 cir:250000, cbd:3072, ebs:3072
DP: MTR_PROFILE ADD: index 4 cir:500000, cbd:3072, ebs:3072
Note: if the last three lines don’t show up, you should re-build the
SPGW-Cand theSPGW-U. See this for more specific instructions.
Configure, build and run the SPGW-C and the SPGW-U
In most cases, the SPGW-C and the SPGW-U are automatically configured, built, and started, during the installation process. However, unexpected errors may occur, or you may simply want to re-configure these components. To do that, follow the steps below.
Warning: Make sure you follow the steps in the order described. The SPGW-U should be built and configured before the SPGW-C
Configuring the SPGW-U
- SSH into
SPGW-UVNF with credentialsngic/ngic(to access the VNF follow these guidelines) - Become sudo
sudo su
- Go to the configuration directory
/root/ngic/config
- Edit the
interface.cfgfile:- dp_comm_ip: the IP address of the
SPGW-Uinterface, attached to the spgw_network - cp_comm_ip: the IP address of the SPGW-C interface, attached to the spgw_network
- dp_comm_ip: the IP address of the
- Edit the
dp_config.cfgfile:- S1U_IFACE: the name of the SPGW-U interface, attached to the s1u_network
- SGI_IFACE: the name of the SPGW-U interface, attached to the sgi_network
- S1U_IP: the IP address of the SPGW-U interface, attached to the s1u_network
- S1U_MAC: the MAC address of the SPGW-U interface, attached to the s1u_network
- SGI_IP: the IP address of the SPGW-U interface attached to the sgi_network
- SGI_MAC: the MAC address of the SPGW-U interface attached to the sgi_network
- Edit the static_arp.cfg file:
- Below the line
[sgi], you should find another line with a similar pattern:IP_addr1 IP_addr2 = MAC_addrIP_addr1andIP_addr2are both the IP address of the vENB interface attached to the sgi_networkMAC_addris the MAC address of the vENB interface, attached to the sgi_network
- Below the line
[s1u], you should find another line with a similar patternIP_addr1 IP_addr2 = MAC_addrIP_addr1andIP_addr2are the IP addresses of the vENB interfaces attached to the s1u_networkMAC_addris the MAC address of the vENB attached to the s1u_network
- Below the line
Note: To know the IP addresses and MAC addresses mentioned above, follow the instructions here.
Note: To know the interface names mentioned above, follow the instructions here.
Configuring the SPGW-C
- SSH into
SPGW-CVNF with credentialsngic/ngic(to access the VNF follow these instructions) - Become sudo
sudo su - Go to the configuration directory
cd /root/ngic/config - Edit the
interface.cfgfile- dp_comm_ip: the IP address of the
SPGW-Uinterface, attached to the spgw_network - cp_comm_ip: the IP address of the
SPGW-Cinterface, attached to the spgw_network
- dp_comm_ip: the IP address of the
- Edit the cp_config.cfg file
- S11_SGW_IP: the IP address of the SPGW-C interface, attached to the s11_network
- S11_MME_IP: the IP address of the vENB interface, attached to the s11_network
- S1U_SGW_IP: the IP addresses of the SPGW-U interface, attached to the s1u_network
Note: To know the IP addresses mentioned above, follow the instructions here.
Note: To know the interface names mentioned above, follow the instructions here.
Building and running the SPGW-U
- SSH into
SPGW-UVNF with credentials ngic/ngic (to access the VNF follow these instructions) - Become sudo
sudo su - Go to the configuration directory
cd /root/ngic/dp Run the following commands:
../setenv.sh
make build
make
./udev.sh > results &
Open
resultsfile. If the process succeeds, you should see an output similar to the one below
DP: RTE NOTICE enabled on lcore 1
DP: RTE INFO enabled on lcore 1
DP: RTE NOTICE enabled on lcore 0
DP: RTE INFO enabled on lcore 0
DP: RTE NOTICE enabled on lcore 3
DP: RTE INFO enabled on lcore 3
DP: RTE NOTICE enabled on lcore 5
DP: RTE INFO enabled on lcore 5
DP: RTE NOTICE enabled on lcore 4
DP: RTE INFO enabled on lcore 4
API: RTE NOTICE enabled on lcore 4
API: RTE INFO enabled on lcore 4
DP: RTE NOTICE enabled on lcore 6
DP: RTE INFO enabled on lcore 6
DP: RTE NOTICE enabled on lcore 2
DP: RTE INFO enabled on lcore 2
Building and running the SPGW-C
SSH into the head node
SSH into SPGW-C VNF with credentials ngic/ngic account (to access the VNF follow the guide, here)
Become sudo (sudo su)
Go to the configuration dir
ectory: cd /root/ngic/cp
Run the following commands
../setenv.sh
make build
make
./run.sh > results &
Open the “results” file. If the process succeeds, you should see an output similar to the one below

            rx       tx  rx pkts  tx pkts   create   modify  b resrc   create   delete   delete           rel acc               ddn
 time     pkts     pkts     /sec     /sec  session   bearer      cmd   bearer   bearer  session     echo   bearer      ddn      ack
    0        0        0        0        0        0        0        0        0        0        0        0        0        0        0
    1        0        0        0        0        0        0        0        0        0        0        0        0        0        0
- Go back to
SPGW-UVNF and openresultsfile in/root/ngic/dp. If the process succeeds, you should see a new output similar to one below
DP: MTR_PROFILE ADD: index 2 cir:125000, cbd:3072, ebs:3072
DP: MTR_PROFILE ADD: index 3 cir:250000, cbd:3072, ebs:3072
DP: MTR_PROFILE ADD: index 4 cir:500000, cbd:3072, ebs:3072
Building and running the SPGW-C
- SSH into the head node
- SSH into
SPGW-CVNF with credentialsngic/ngic(to access the VNF follow these instructions) - Become sudo
sudo su
- Go to the configuration directory:
cd /root/ngic/cp
- Run the following commands
../setenv.sh
make build
make
./run.sh > results &
- Open the
resultsfile. If the process succeeds, you should see an output similar to the one below
            rx       tx  rx pkts  tx pkts   create   modify  b resrc   create   delete   delete           rel acc               ddn
 time     pkts     pkts     /sec     /sec  session   bearer      cmd   bearer   bearer  session     echo   bearer      ddn      ack
    0        0        0        0        0        0        0        0        0        0        0        0        0        0        0
    1        0        0        0        0        0        0        0        0        0        0        0        0        0        0
- Go back to
SPGW-UVNF and openresultsfile in/root/ngic/dp. If the process succeeds, you should see a new output similar to one below
DP: MTR_PROFILE ADD: index 2 cir:125000, cbd:3072, ebs:3072
DP: MTR_PROFILE ADD: index 3 cir:250000, cbd:3072, ebs:3072
DP: MTR_PROFILE ADD: index 4 cir:500000, cbd:3072, ebs:3072
Troubleshooting with the NG40 vTester
The guide describes how the NG40 results should be interpreted for troubleshooting.
Failure on S11 or SPGW-C not running
Signaling Table
           AttUE     ActCTXT   BrReq     BrAct     RelRq     RelAc     ActS1
ng40_ran_1 0         0         0         0         0         0         1

User Plane Downlink Table
           AS_PktTx      AS_EthTx      S1uEthRx      S1uPktRx
ng40_ran_1 0             0             0             0

User Plane Uplink Table
           S1uPktTx      S1uEthTx      AS_EthRx      AS_PktRx
ng40_ran_1 0             0             0             0

Watchtime: 57 Timeout: 1800
All Tests are finished
Verdict(tc_attach) = VERDICT_FAIL
**** Packet Loss ****
No pkt DL tx
No pkt UL tx
Wait for RAN shutdown
done
Testlist verdict = VERDICT_FAIL
When you see a VERDICT_FAIL and there are 0 values for BrReq and BrAct in the Signaling table, check if the SPGW-C is running. If it is, check the S11 connection between the NG40 VM and the SPGW-C VM. The verify_attach.sh test can help you to verify the status of the control plane connectivity on the S11 network.
If the ActS1 counter is 0, there’s an internal error on the S1mme interface, or the NG40 components did not start correctly.
Run the command ng40forcecleanup all to restart all the NG40 components. The NG40 system components may take some time to start.
Wait 10 seconds before you start a new test.
Failure on S1u and Sgi or SPGW-U
Signaling Table
           AttUE     ActCTXT   BrReq     BrAct     RelRq     RelAc     ActS1
ng40_ran_1 0         0         1         1         0         0         1

User Plane Downlink Table
           AS_PktTx      AS_EthTx      S1uEthRx      S1uPktRx
ng40_ran_1 185           0             0             0

User Plane Uplink Table
           S1uPktTx      S1uEthTx      AS_EthRx      AS_PktRx
ng40_ran_1 64            0             0             0

Watchtime: 18 Timeout: 1800
All Tests are finished
Verdict(tc_attach_www) = VERDICT_PASS
**** Packet Loss ****
DL Loss= AS_PktTx-S1uPktRx=     185(pkts); 100.00(%)
UL Loss= S1uPktTx-AS_PktRx=     64(pkts); 100.00(%)
If you running attach_verify_data.sh and you see VERDICT_PASS but 100% DL and UL Loss values, check if the SGPW-U is running. If it is, check the S1u and the SGi connections.
When packets are generated (see values AS_PktTx and S1uPktTx), but are not sent to Ethernet (see values AS_EthTx and S1uEthTx) it may be that no NG40 ARP requests get answered.
Routing problem on S1u
Signaling Table
           AttUE     ActCTXT   BrReq     BrAct     RelRq     RelAc     ActS1
ng40_ran_1 0         0         1         1         0         0         1

User Plane Downlink Table
           AS_PktTx      AS_EthTx      S1uEthRx      S1uPktRx
ng40_ran_1 185           185           185           185

User Plane Uplink Table
           S1uPktTx      S1uEthTx      AS_EthRx      AS_PktRx
ng40_ran_1 64            66            0             0

Watchtime: 18 Timeout: 1800
All Tests are finished
Verdict(tc_attach_www) = VERDICT_PASS
**** Packet Loss ****
DL Loss= AS_PktTx-S1uPktRx=     185(pkts); 0.00(%)
UL Loss= S1uPktTx-AS_PktRx=     64(pkts); 100.00(%)
When you run attach_verify_data.sh and you see Data sent on S1u and SGi (see values AS_EthTx and S1uEthTx), but no data received at the Application Server (see values AS_EthRx and AS_PktRx), check the SPGW-U CDRs. If the packets going uplink are processed in the CDRs, either your routing or the allowed IP settings on the SGi interface are not correct.
If packets are processed, but 0 bytes are sent through the uplink, there’s a mismatch in the GTPU header size configuration. For example the SPGW-U is compiled together with a SessionID, but the NG40 VM is configured without SessionID.
Other problems
If you see timeouts, exceptions, strange behaviors or the ActS1 counter is 0, try one of the solutions below:
- Cleanup and restart the NG40 process, running
ng40forcecleanup all. Wait about 10 seconds to allow the system to restart. Then, run a new test. - Check the NG40 license is still active, and in case install a new one, as described here.
Re-initialize the NG40 processes, running
~/install/ng40init.