I don't see any AttWorkflowServiceInstances
If you have added an OLT in the system but you see no AttWorkflowServiceInstances you can debug it following these steps.
Check the status in VOLTHA
Connect to the VOLTHA CLI and check the devices:
(voltha) devices
Devices:
+------------------+-------------------+------+------------------+------------------+-------------+-------------+----------------+----------------+------------------+------------------------+-------------------------+--------------------------+----------------------+------------------------------+
|               id |              type | root |        parent_id |    serial_number | admin_state | oper_status | connect_status | parent_port_no |    host_and_port |                 reason | proxy_address.device_id | proxy_address.channel_id | proxy_address.onu_id | proxy_address.onu_session_id |
+------------------+-------------------+------+------------------+------------------+-------------+-------------+----------------+----------------+------------------+------------------------+-------------------------+--------------------------+----------------------+------------------------------+
| 00012d28315ddb79 |           openolt | True | 000100000a5a007a | 10.90.0.122:9191 |     ENABLED |      ACTIVE |      REACHABLE |                | 10.90.0.122:9191 |                        |                         |                          |                      |                              |
| 0001d18bedd13517 | brcm_openomci_onu | True | 00012d28315ddb79 |     ALPHe3d1cfe3 |     ENABLED |      ACTIVE |      REACHABLE |      536870912 |                  | initial-mib-downloaded |        00012d28315ddb79 |                          |                    1 |                            1 |
| 00011c399faa957d | brcm_openomci_onu | True | 00012d28315ddb79 |     ALPHe3d1cf9d |     ENABLED |  DISCOVERED |      REACHABLE |      536870912 |                  |          starting-omci |        00012d28315ddb79 |                          |                    2 |                            2 |
+------------------+-------------------+------+------------------+------------------+-------------+-------------+----------------+----------------+------------------+------------------------+-------------------------+--------------------------+----------------------+------------------------------+
AttWorkflowServiceInstances are created once the ONUs reach are in oper_status=ACTIVE,
so at this given time we should expect to see only one AttWorkflowServiceInstances.
Now check the logical device representing that OLT and verify that it shows active UNI ports:
(voltha) logical_devices
Logical devices:
+------------------+------------------+------------------+------------------+---------------------------+--------------------------+
|               id |      datapath_id |   root_device_id |  desc.serial_num | switch_features.n_buffers | switch_features.n_tables |
+------------------+------------------+------------------+------------------+---------------------------+--------------------------+
| 000100000a5a007a | 000000000a5a007a | 00012d28315ddb79 | 10.90.0.122:9191 |                       256 |                        2 |
+------------------+------------------+------------------+------------------+---------------------------+--------------------------+
(voltha) logical_device 000100000a5a007a
(logical device 000100000a5a007a) ports
Logical device ports:
+-----------+------------------+----------------+-----------+------------------+------------------------------+---------------+----------------+---------------+---------------------+------------------------+
|        id |        device_id | device_port_no | root_port | ofp_port.port_no |             ofp_port.hw_addr | ofp_port.name | ofp_port.state | ofp_port.curr | ofp_port.curr_speed | ofp_port_stats.port_no |
+-----------+------------------+----------------+-----------+------------------+------------------------------+---------------+----------------+---------------+---------------------+------------------------+
| nni-65536 | 00012d28315ddb79 |          65536 |      True |            65536 |     [0L, 0L, 0L, 1L, 0L, 0L] |     nni-65536 |              4 |          4128 |                  32 |                  65536 |
|    uni-32 | 00011c399faa957d |             32 |           |               32 |    [8L, 0L, 0L, 0L, 0L, 32L] |  ALPHe3d1cf9d |              4 |          4160 |                  64 |                        |
|    uni-16 | 0001d18bedd13517 |             16 |           |               16 |    [8L, 0L, 0L, 0L, 0L, 16L] |  ALPHe3d1cfe3 |              4 |          4160 |                  64 |                        |
+-----------+------------------+----------------+-----------+------------------+------------------------------+---------------+----------------+---------------+---------------------+------------------------+
If no ports are shown an error has occurred in VOLTHA, if everything looks correct you can proceed to the next step.
Check the status in ONOS
Connect to the ONOS CLI and check devices:
onos> devices
id=of:0000000000000002, available=true, local-status=connected 5h33m ago, role=MASTER, type=SWITCH, mfr=Accton Corp., hw=x86-64-accton-as6712-32x-r0, sw=ofdpa 3.0.5.5+accton1.7-1, serial=671232X1538038, chassis=2, driver=ofdpa3, channelId=10.90.0.120:46211, locType=none, managementAddress=10.90.0.120, name=AGG_SWITCH, protocol=OF_13
id=of:000000000a5a007a, available=true, local-status=connected 4h19m ago, role=MASTER, type=SWITCH, mfr=VOLTHA Project, hw=, sw=, serial=10.90.0.122:9191, chassis=a5a007a, driver=voltha, channelId=10.233.102.179:59154, locType=none, managementAddress=10.233.102.179, name=SHAD OLT, protocol=OF_13
You should see the aggregation switch and the logical device representing the PON.
If you can't see the logical device (mfr=VOLTHA Project) then an error occurred
in the communication between the VOLTHA ofagent component and ONOS.
Check if ONOS can see the active ports on the logical device:
onos> ports -e of:000000000a5a007a
id=of:000000000a5a007a, available=true, local-status=connected 4h21m ago, role=MASTER, type=SWITCH, mfr=VOLTHA Project, hw=, sw=, serial=10.90.0.122:9191, chassis=a5a007a, driver=voltha, channelId=10.233.102.179:59154, locType=none, managementAddress=10.233.102.179, name=SHAD OLT, protocol=OF_13
  port=16, state=enabled, type=fiber, speed=0 , adminState=enabled, portMac=08:00:00:00:00:10, portName=ALPHe3d1cfe3
  port=32, state=enabled, type=fiber, speed=0 , adminState=enabled, portMac=08:00:00:00:00:20, portName=ALPHe3d1cf9d
  port=65536, state=enabled, type=fiber, speed=0 , adminState=enabled, portMac=00:00:00:01:00:00, portName=nni-65536
If you don't see the ports there's again some issue in the communication between the VOLTHA ofagent component and ONOS.
If everything looks correct you can move to the next step.
Check events in Kafka
Use Kibana
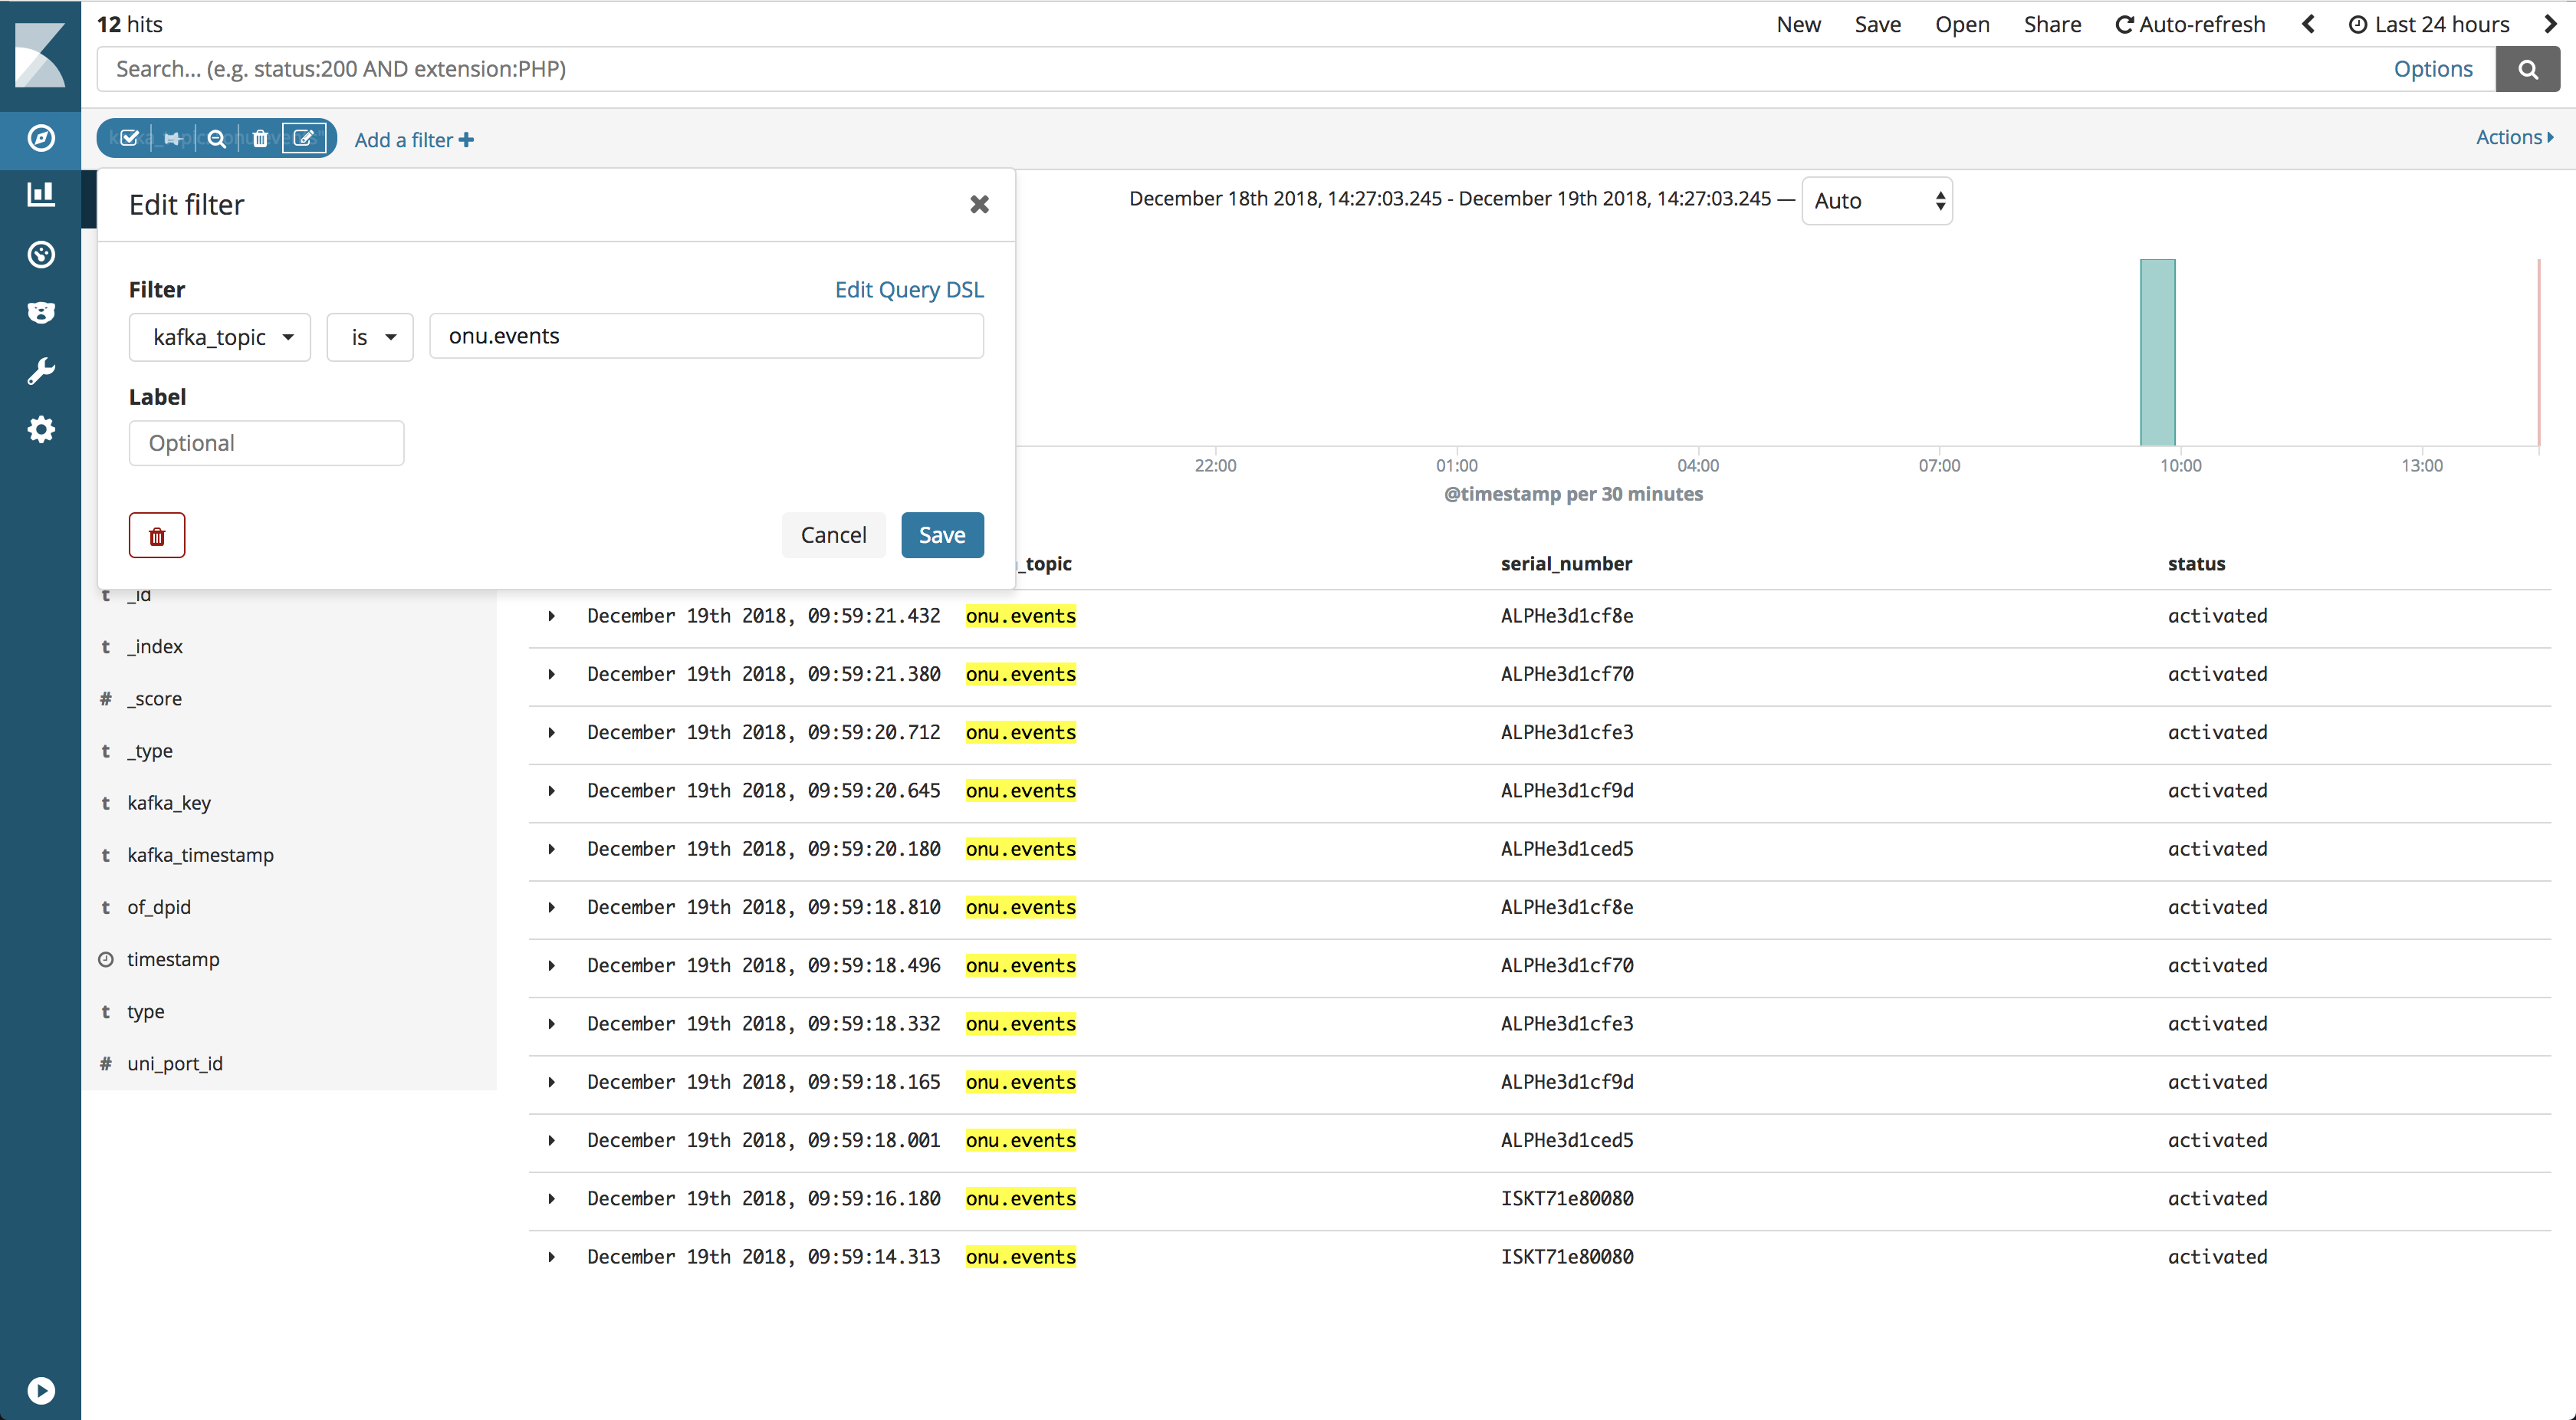
If you have installed the Logging component of the platform you can then look in Kibana for these events.
Connect to the dashboard an search for events in the onu.events topic:

Check in Kafka
You can install kafkacat on the POD using this command:
helm install -n kfc cord/kafkacat
Then you'll need to access the container and list the messages on the onu.events
topic:
kubectl exec -it kafkacat-7f45f65485-2lgp8 bash
root@kafkacat-7f45f65485-2lgp8:/# kafkacat -b cord-platform-kafka -t onu.events
Note: Replace
cord-platform-kafkawithcord-kafkain the command above if kafka was installed as a standalone component.
If everything is correct you should see:
{"timestamp":"2018-12-19T22:34:00.755Z","status":"activated","serial_number":"ALPHe3d1cfe3","uni_port_id":16,"of_dpid":"of:000000000a5a007a"}
If you can see events in Kafka you can proceed with the next step.
Check the AttWorkflowDriver container
This is the last step of the process, if you have events in kafka, you should
check the logs of the att-workflow-driver container.
You can do that using this command:
kubectl logs -f att-workflow-att-workflow-driver-7c8bc95894-xgxts